Why Study Advanced Patterns?
Head and Shoulders Pattern:
🔹 Example:
A stock forms three peaks, with the middle peak (head) higher than the two shoulders.
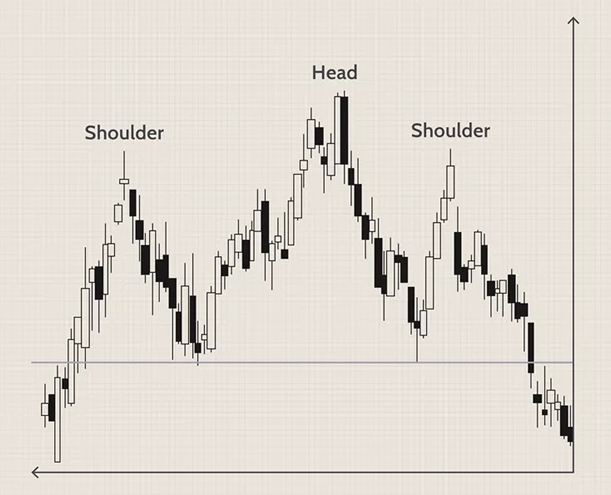
Credit: Image by Sabrina Jiang © Investopedia 2020
Inverse Head and Shoulders:
🔹 Example:
After a downtrend, stock creates an inverse pattern, suggesting an upward reversal.
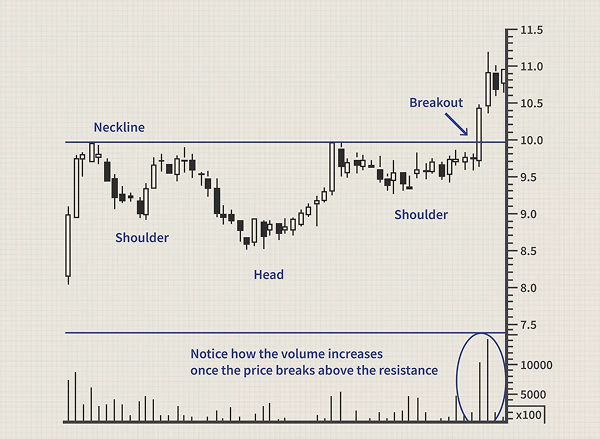
Credit: Image by Sabrina Jiang © Investopedia 2020
Double and Triple Tops/Bottoms:
🔹 Example:
Double top at resistance, indicating bearish reversal.
Triangles (Ascending, Descending, Symmetrical):
🔹 Example:
Ascending triangle in an uptrend suggests likely breakout upward.
Flags and Pennants:
🔹 Example:
Bullish flag pattern during an uptrend indicates potential continuation higher.
Cup and Handle:
🔹 Example:
Price forms a rounded bottom (cup) followed by a small downward drift (handle), then resumes upward.
Wedges (Rising and Falling):
🔹 Example:
Rising wedge in an uptrend typically forecasts a bearish reversal.
Importance of Volume:
Interpreting Volume in Patterns:
🔹 Example:
Significant volume increase during a breakout of a triangle pattern indicates a stronger move.
Entry Strategies:
Exit Strategies:
Risk Management:
Trade Example 1: Head and Shoulders
Trade Example 2: Bullish Flag
Mistakes:
Solutions:
You are now equipped with advanced knowledge of chart patterns and strategic insights for more profitable trading. Sky Links Capital offers sophisticated tools, ongoing education, and expert support to further refine your trading skills.
Enhance your trading results today—partner with Sky Links Capital for continued trading success!
Disclaimer: The information and tools provided by Sky Links Capital are strictly for educational and informational purposes only. They do not constitute financial advice, investment recommendations, or an offer to buy or sell any financial instruments. Users should make independent decisions based on their own research and, where appropriate, seek professional advice.
Risk Warning: Trading in any Financial Instrument is complex and carries a high risk of losing money rapidly due to leverage. It may not be suitable for all investors. Before engaging in any trading activities, you should carefully assess your investment objectives, risk tolerance, and financial situation. If necessary, seek independent financial advice before proceeding with trading.
Sky Links Holding Ltd is a prescribed holding company incorporated in the Dubai International Financial Centre (DIFC), established solely to hold equity interests in financial services subsidiaries. It does not engage in regulated activities or operational control; subsidiaries operate independently under their own regulatory frameworks. The holding company supports capital stability, strategic alignment, and shareholder value across the group.
Sky Links Capital L.L.C. has its registered office located at Offices 208, BB03, Bay Square, Business Bay, Dubai, United Arab Emirates, and is registered with the Dubai Economic Department under License Number 1385407.
Sky Links Capital L.L.C. is a company licensed and regulated by the Securities and Commodities Authority under Category 5, with license number 20200000235. The SCA regulated company, acting as an Introductory firm, in partnership with Sky Links Capital Limited and other renowned regulated entities, is authorized to facilitate services for UAE residents and nationals. Sky Links Capital L.L.C. operates strictly as an Introductory entity and is not authorized to provide investment advice, manage, or hold clients’ assets or money. All services rendered by Sky Links Capital L.L.C. are provided solely on an Introductory basis.
Sky Links Capital Limited is a Limited Company with Investment Dealer (Full Service Dealer excluding Underwriting) under License No. GB24202837 and is authorized and regulated by the Financial Services Commission (FSC) in Mauritius.
Sky Links Capital L.L.C. is a Limited Liability Corporation registered in St Vincent & The Grenadines with registration no. 3698LLC2024.
Sky Links Capital Limited may publish general market commentary from time to time. Sky Links Capital Limited and Sky Links Capital L.L.C. accept no responsibility for any use of the content presented and any consequences of that use. No representation or warranty is given as to the completeness of this information. Anyone acting on the information provided does so at their own risk. The information contained herein is not intended for distribution to residents in any country where such distribution or use would contravene any local law or regulatory requirement. Our products and services are not available to embargoed or sanctioned countries. The information is not intended for distribution to, or use by, any person in any country or jurisdiction where such distribution or use would be contrary to local law or regulation.
Office#208, BB03, Bay Square, Business Bay, Dubai, UAE
+97144957000
Premier Business Center, 10th Floor, Sterling Tower, 14 Poudrière St, Port Louis, Mauritius
+230 5 8282426
Suite 430, Beachmont Business Center, Kingstown, Saint Vincent and the Grenadines.
+784 5324533
2025 Copyright © Sky Links Capital Limited.