Introduction
Welcome to Basics of Technical Analysis! This ebook is your essential guide to understanding the fundamentals of technical analysis, empowering you to make informed trading decisions based on historical market data.
Chapter 1: What is Technical Analysis?
Technical analysis involves evaluating securities by analyzing statistical trends from trading activity, such as price movement and volume.
Key Principles:
Prices reflect all available information.
History tends to repeat itself.
Prices move in trends.
Chapter 2: Charts and Their Types
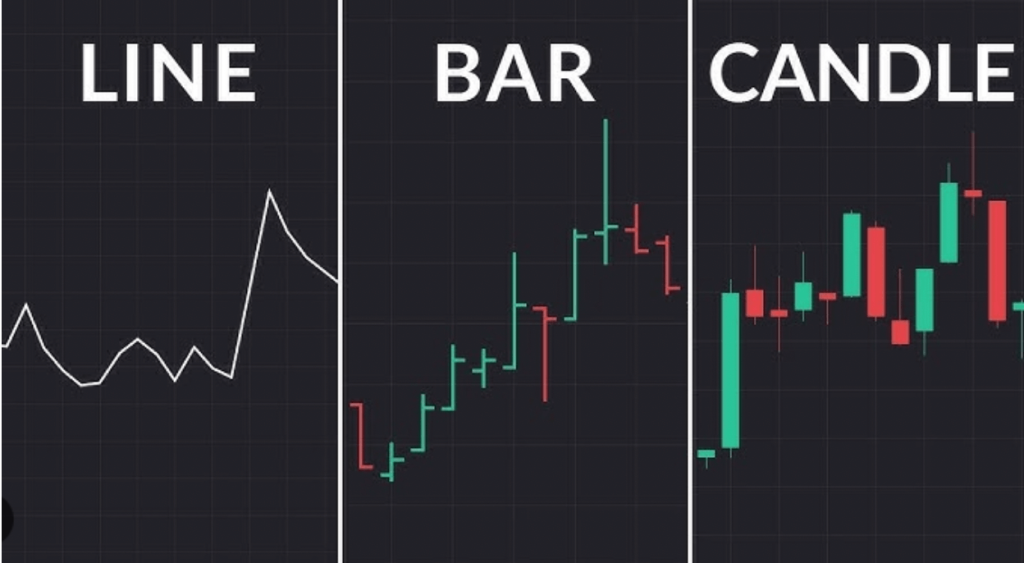
Common charts used in technical analysis:
Line Chart: Simple visual representation of closing prices.
Bar Chart: Includes open, high, low, and closing prices.
Candlestick Chart: Most detailed, showing price movements clearly and visually.
Chapter 3: Identifying Trends
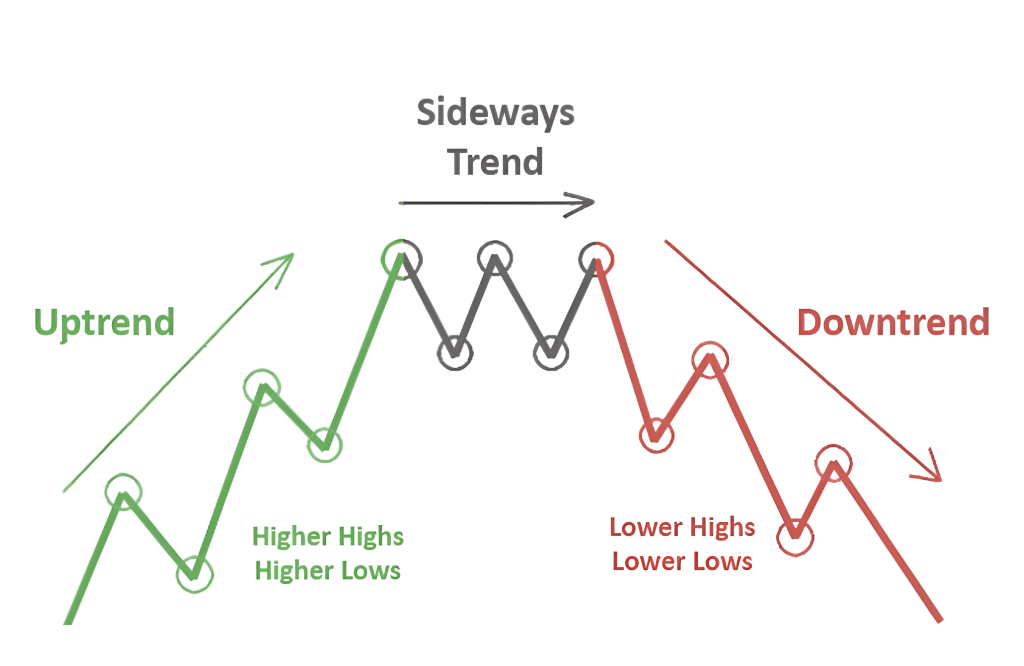
Three basic types of trends:
Uptrend: Prices moving higher (higher highs and higher lows).
Downtrend: Prices moving lower (lower highs and lower lows).
Sideways (Range): Prices fluctuate within a defined range.
Chapter 4: Support and Resistance
Essential concepts:
Support Level: Price level where buying is strong enough to prevent further decline.
Resistance Level: Price level where selling is strong enough to prevent further increase.
🔹 Example:
A stock consistently finds support at $100 and resistance at $110. Traders might buy near $100 and sell near $110.
Chapter 5: Chart Patterns
Key patterns for identifying market movements:
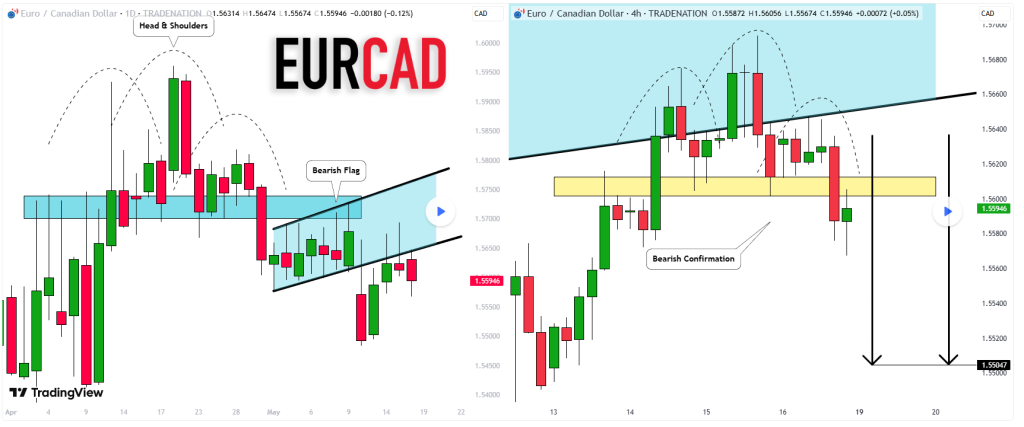
Head and Shoulders: Indicates potential trend reversal.
Credit: TradingView
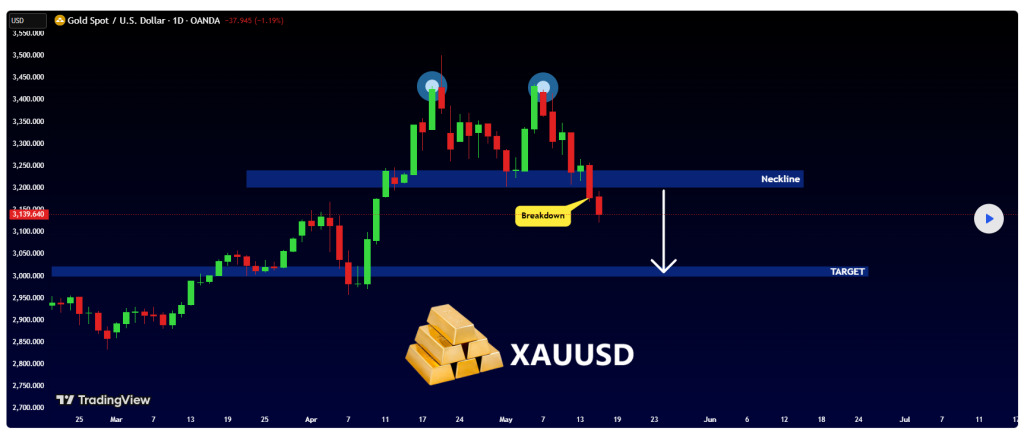
Double Top/Double Bottom: Suggests possible reversals.
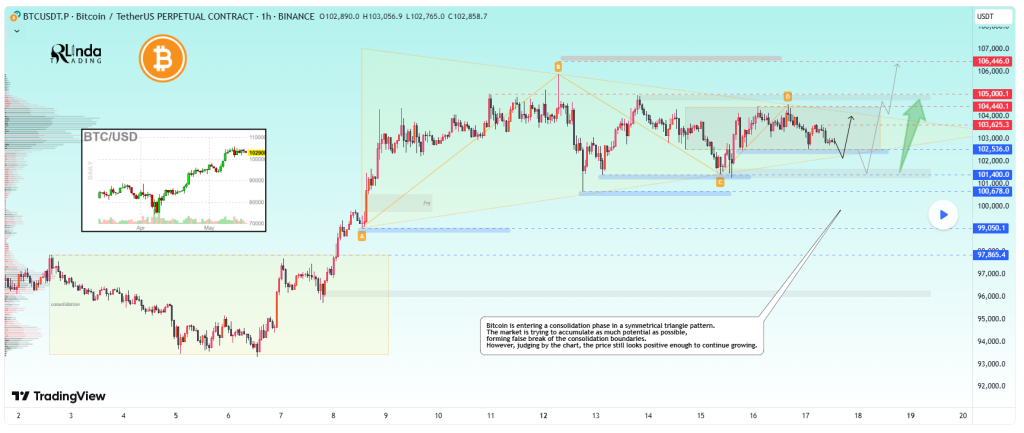
Triangles: Indicates continuation or reversal of trends.
Credit: TradingView
Chapter 6: Technical Indicators
Important indicators:
Moving Averages (MA): Identify trend directions.
Relative Strength Index (RSI): Indicates overbought or oversold conditions.
Moving Average Convergence Divergence (MACD): Shows trend momentum and potential reversals.
🔹 Example:
An RSI above 70 suggests an asset might be overbought and potentially due for a price decline.
Chapter 7: Volume Analysis
Volume indicates the strength of price movements:
High Volume: Indicates strong conviction behind price moves.
Low Volume: Indicates weak conviction or indecision.
Chapter 8: Fibonacci Retracements
Predicting potential reversal levels using Fibonacci numbers:
Common levels: 23.6%, 38.2%, 50%, 61.8%, and 78.6%.
🔹 Example:
After a significant uptrend, prices may retrace to the 50% Fibonacci level before continuing upward.
Chapter 9: Putting Technical Analysis into Action
Practical application:
Select your instrument (stock, forex, commodity).
Identify trends using charts.
Apply indicators to confirm your analysis.
Define entry and exit points clearly.
🔹 Example:
Buy when a price breaks above resistance with high volume and positive MACD signal.
Conclusion: Start Your Technical Analysis Journey
You now understand:
Fundamental concepts of technical analysis
How to read various charts and patterns
Key indicators and their applications
How to practically apply technical analysis to trading decisions
Sky Links Capital provides comprehensive resources and expert guidance to enhance your technical analysis skills.
Take action today—partner with Sky Links Capital and elevate your trading expertise!
Disclaimer: The information and tools provided by Sky Links Capital are strictly for educational and informational purposes only. They do not constitute financial advice, investment recommendations, or an offer to buy or sell any financial instruments. Users should make independent decisions based on their own research and, where appropriate, seek professional advice.